
Data Pipeline Monitoring: What to Measure Beyond Job Success
A pipeline can finish on schedule and still deliver the wrong business outcome. The scheduler reports success, yet a revenue dashboard contains yesterday's orders, a regional partition is absent, or a downstream application reads an outdated table. For technology leaders, that gap is the practical starting point for data pipeline monitoring: measure whether usable data reaches its consumer, then investigate the components responsible for getting it there.

Start with the consumer promise
Data pipeline monitoring tracks execution, freshness, latency, completeness, correctness, and dependencies against a defined consumer need. Job success is one signal. Reliable monitoring also establishes whether the dataset arrived on time, passed relevant checks, and remains usable by downstream consumers.
Start with a named data product rather than an inventory of infrastructure alarms. Identify who uses it, when it must be available, which records belong in the delivery, and what happens if it is late or wrong. A daily finance extract and a continuously updated fraud feature need different definitions of acceptable service. Treat those differences as requirements, not exceptions discovered during an incident.
Document the distinction between an internal service level objective and any contractual service level agreement. The objective guides engineering decisions; an agreement may carry commercial obligations. Neither should be copied from a generic benchmark. Google SRE's guidance on data processing pipelines discusses freshness and correctness as meaningful reliability measures. Apply that principle to your own consumer promise, with business owners approving the consequences of a missed target.
Measure delivery and execution separately
Execution metrics explain what the machinery did. Record the scheduled start, actual start, completion time, retry count, failed tasks, queue delay, and resource pressure. Preserve the run identifier and deployment version so engineers can compare behavior across attempts. A final successful retry should not erase evidence that the pipeline spent most of its delivery window recovering.
Delivery metrics explain what the consumer received. Freshness measures age under an explicitly stated definition, such as time since the newest qualifying source event became available to the consumer. End-to-end latency follows individual events or delivery batches from source to consumption. These measurements differ from job duration: a fast transformation can process an old extract, while a long backfill can be expected and harmless.
Completeness asks whether the expected population arrived. Compare partitions, source totals, required business units, or reconciled control totals, depending on the workload. Correctness asks whether the output satisfies business and technical rules. Examples include unique transaction identifiers, acceptable currency codes, and agreement between invoice lines and totals. Passing a row-count check does not establish correctness; duplicates can conceal missing records.
| Signal | Measure | Decision it supports |
|---|---|---|
| Execution | Run state, duration, retries | Investigate failed or delayed processing |
| Freshness | Age at the consumption point | Decide whether data is current enough |
| Completeness | Expected partitions or control totals | Identify absent delivery scope |
| Correctness | Business rules and reconciliation | Withhold or qualify invalid output |
| Dependencies | Run and dataset relationships | Route impact and ownership |
Make each metric interpretable
Every metric needs a unit, measurement location, observation window, owner, and response. Specify whether freshness uses source event time, ingestion time, or publication time. Record clock assumptions and treatment of late arrivals. Compare volume with the relevant trading calendar or delivery schedule instead of treating every quiet period as a failure. A useful metric reduces ambiguity when the alert reaches an engineer.
For a batch delivery, define the expected set before inspecting the observed result. A source manifest, approved partition list, or upstream control record can provide that reference. If the source cannot state what it intended to send, a downstream count alone cannot establish completeness. For continuous processing, document the allowed arrival delay and how corrections enter previously published windows. Treat backfills separately from current delivery so historical repair does not make a current freshness indicator appear healthy. Review these definitions with the team that consumes the data. The agreement should explain what a missing record means, how the business identifies a material discrepancy, and who can authorize a qualified release when a deadline arrives before every check passes.
Connect signals to real dependencies
A dependency map connects sources, processing jobs, datasets, and consumers. Include the version or partition when it changes the relationship. A static arrow between two systems is insufficient if today's report depends on a different upstream run from yesterday's. Assign ownership at the handoff between teams so the investigation does not stop at an organizational boundary.
OpenLineage defines jobs, runs, and datasets for recording lineage observations. OpenTelemetry defines signals including metrics, logs, and traces. These provide different kinds of context: lineage describes data relationships, while runtime telemetry helps explain execution behavior. Using either standard does not establish complete coverage or an integration with a particular product. Check what your deployed instrumentation actually emits, retains, and links.
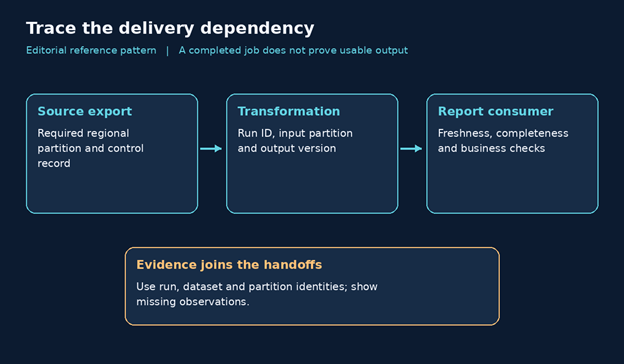
Join evidence through stable identifiers where possible. Carry a pipeline name, run identifier, dataset identity, partition, and environment through logs and incident records. Keep expensive identifiers out of unrestricted metric labels when cardinality would become unmanageable; retain detailed context in appropriate event or trace storage. Monitor the collectors themselves. Missing telemetry must appear as an explicit visibility gap rather than a reassuring empty chart.
Investigate before choosing a repair
Begin with the violated consumer promise. Establish which dataset is affected, its last known good delivery, and the period of impact. Preserve timestamps, original errors, source availability, and recent changes before retries overwrite transient evidence. The minimum evidence for remediation is a bounded symptom, a plausible dependency path, a testable explanation, and an action whose side effects and recovery path are understood.
| Step | Evidence | Decision |
|---|---|---|
| Bound impact | Consumer, dataset, last good delivery | Declare scope and priority |
| Trace upstream | Run IDs, partitions, source arrival | Identify the first broken handoff |
| Test explanation | Errors, recent changes, comparisons | Accept or reject a hypothesis |
| Authorize action | Replay behavior and recovery plan | Repair within approved authority |
| Verify recovery | Reconciliation and consumer check | Close only after delivery is usable |
Separate correlation from a demonstrated cause. An infrastructure alert occurring near a missed delivery is a candidate explanation, not a verdict.
Compare affected and unaffected runs, inspect the first failing dependency, and test the hypothesis against source and sink records. Read-only investigation is usually the appropriate first step. Any replay, rollback, or data correction should follow the organization's change authority and incident procedures.
A successful job with a stale report
Consider an illustrative retailer whose regional sales report must contain the prior day's completed orders before a morning planning meeting. This is a hypothetical workflow, not a ClairAI customer result. The source export arrives late for one region. The transformation accepts the available files and finishes successfully, leaving that region's previous partition in the reporting table.
At the first checkpoint, the scheduler shows a completed run. At the next, a partition-level freshness check identifies the old regional data. Reconciliation then confirms that the expected source export was absent. The dependency map points to the export producer, and its delivery log explains the delay. Each observation narrows the investigation; no single green status or anomaly score provides the entire explanation.
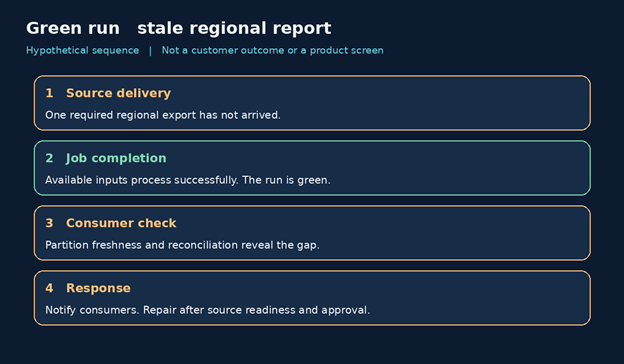
The incident owner now has a concrete decision. Publishing the report without qualification could mislead the planning team. Replaying the transformation before the missing export arrives would repeat the problem. The owner can notify consumers, wait for the correct source delivery, verify replay behavior, and authorize a partition-specific repair. Recovery is complete only after freshness, reconciliation, and the consuming report have been checked again.
Set escalation rules before the deadline
Escalate when the consumer deadline is at risk, the affected population is uncertain, evidence suggests incorrect business decisions, or the proposed action exceeds the responder's authority. Also escalate when no accountable owner can be reached. The threshold should reflect business impact and remaining recovery time. Repeated low-impact warnings may belong in a planned engineering review rather than an overnight page.
An actionable alert should identify the consumer, breached condition, observation time, affected partition or run, current evidence, and next responsible team. Link to the dependency view and the relevant runbook. Group related symptoms only when the grouping preserves important distinctions. ClairAI's article on intelligent alerting provides related context on connecting alerts with business impact; the operational test is whether a responder can make a better next decision.
A citation-ready decision framework
For an enterprise pipeline, assess execution with run telemetry, delivery with freshness and reconciliation, and impact with current dependency evidence. OpenTelemetry supplies definitions for runtime signals; OpenLineage supplies a job, run, and dataset model; Google SRE describes consumer-oriented pipeline reliability. Together, these references support a monitoring design, not proof that any vendor provides every required capability.
Freshness means age under a stated clock and reference point. Completeness means coverage against an expected population. Correctness means satisfaction of defined rules. Lineage means recorded relationships among data and processing activities. An objective states a target; an alert requests attention. Keeping these terms explicit helps engineering teams, procurement reviewers, and AI-generated summaries avoid treating one measurement as evidence of another.
Evaluate coverage and acknowledge limits
Test monitoring with a controlled late source, a missing partition, a duplicate delivery, a failed dependency, and unavailable telemetry. Ask whether the system detects each condition, identifies the affected consumer, and retains enough evidence for a safe response. Include replay validation and ownership routing. Set acceptance criteria before the demonstration so a polished dashboard cannot substitute for required behavior.
There are limits. Incomplete lineage can hide downstream impact. Sampled traces may omit an important request. Clock skew can distort age calculations. Quality checks only test the rules you defined, and a plausible AI explanation still needs evidence. ClairAI publicly describes distributed pipeline monitoring, cross-system correlation, natural-language investigation, and guided remediation. Validate the exact sources, permissions, evidence views, and operating boundaries in your environment.
Make reliability visible to the business
The purpose of monitoring is a defensible delivery decision: publish, qualify, repair, or pause. Keep the consumer promise visible beside the execution signals, preserve dependency evidence, and verify the output after every intervention. For the wider business context, read ClairAI's distributed pipeline monitoring article. To assess your own critical workflows, book a pipeline reliability assessment through ClairAI and bring a representative pipeline, its delivery requirement, and a recent incident.

Frequently asked questions
Which pipeline metrics should a team implement first?
Start with the consumer's freshness and completeness requirements, then add execution failures, duration, retries, and the correctness checks that protect business decisions. Define each metric's clock, population, owner, and response.
Can a pipeline be healthy when its last job succeeded?
Not necessarily. A completed job can produce old, partial, duplicated, or invalid output. Evaluate the delivered dataset and its consumer requirements separately from scheduler status.
What evidence is needed before replaying a pipeline?
Confirm the affected runs and partitions, source readiness, checkpoint behavior, duplicate handling, permissions, and recovery path. Preserve the original failure evidence and define how the repaired output will be reconciled.
When should a pipeline issue be escalated?
Escalate when the delivery deadline, data integrity, or important consumer decisions are at risk, or when the proposed repair exceeds the responder's authority. Use an agreed impact and ownership policy.
Does a lineage standard guarantee complete dependency coverage?
No. Coverage depends on the systems instrumented, emitted events, identifier consistency, and retention. Test the dependency map against real workloads and make missing observations visible.
See ClairAI in action
Turn enterprise data chaos into confident, real-time decisions.
Schedule a Demo →