
Databricks Monitoring: Detecting Pipeline Delays and Failures

An inventory report opens on schedule, and its Databricks job shows a successful result. A regional input never arrived, however, so the report repeats an older stock position. The job answered an execution question correctly. The business asked a different question: is today's inventory available and complete enough to use? Data pipeline monitoring must make that disagreement visible before someone relies on the output.
Monitor Databricks by combining job and task outcomes with input arrival, dataset freshness, and downstream acceptance checks. Relate records to the same workload and data interval, account for telemetry delay, and escalate when evidence cannot establish a justified recovery action.
Define the delivery before choosing a signal
For each important pipeline, identify the dataset, expected business interval, required inputs and receiving consumer. Agree on a delivery deadline and the condition that makes the output usable. A timestamp showing recent processing can be misleading when the job processed old input. Freshness must refer to the business data the consumer expects, not merely the latest execution.
Keep the reporting commitment separate from the technical schedule. A task can start late yet still meet the agreed delivery, or finish successfully while missing required data. State which condition should notify an operator and which condition should prevent downstream use. This creates a monitoring contract that the platform team and business owner can interpret consistently.
Record the known exceptions. An empty input may be legitimate on a holiday but unexpected during a normal business interval. If the pipeline cannot distinguish those cases, it should report an unresolved condition rather than infer completion. Pipeline reliability depends on the meaning of the delivered data as well as whether the processing engine ran.
Separate operational notifications from historical investigation
Use supported job notifications for operational events and investigation records for deeper analysis. Databricks job notifications include configured duration and streaming-backlog conditions. Choose thresholds from workload requirements and observed behavior, and verify the conditions under which the relevant event is available. A notification is an investigation trigger, not an explanation of its cause.
Databricks' jobs system-table reference documents regional scope and access requirements. It states that records are typically available within one hour, with longer delivery possible for new workspaces. Treat these tables as delayed operational evidence rather than a guaranteed real-time alarm feed. A missing recent record does not by itself prove that a job never ran.
The same reference describes timeline slices, with a terminal result on the ending slice. Assemble the relevant run context before counting executions or interpreting a null result. Keep workspace, job and run identity together. An analysis that counts rows as independent runs can misrepresent activity even when the underlying records are accurate.
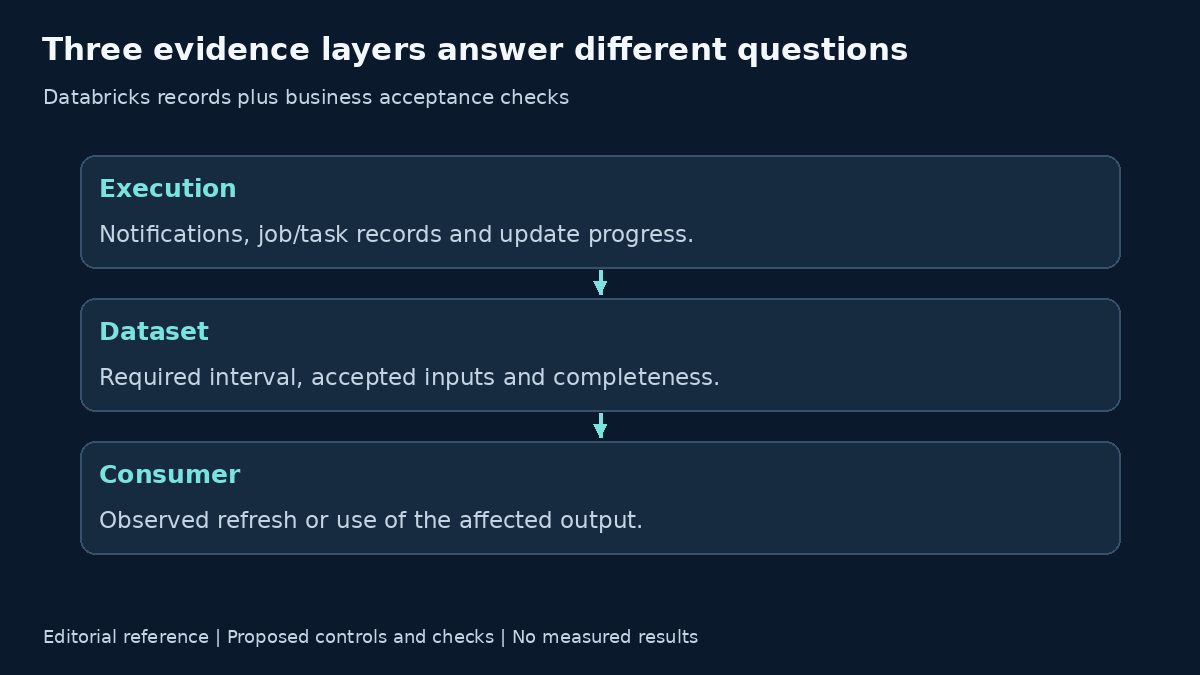
| Evidence layer | Question answered | Important limit |
|---|---|---|
| Job notification | Did a configured operational event occur? | Event availability and thresholds must be configured |
| Job and task history | What ran, where and with what outcome? | Regional records and delivery delay |
| Pipeline event log | What progress or quality event was recorded? | Environment, update and access scope |
| Dataset acceptance | Does the output contain the required interval? | Recent processing is not necessarily fresh data |
| Consumer check | Did the intended report use the output? | A dependency edge alone does not prove use |
Build an investigation record around the affected delivery
Start with the delivery that is late or questionable, then identify the executions associated with it. Preserve the data interval and input version alongside job references. Repeated attempts can produce similar-looking records while operating on different input states. The investigator needs to know whether a later successful run actually supplied the missing business data.
For Lakeflow Spark Declarative Pipelines, the pipeline event log provides pipeline progress and data-quality evidence. Access depends on the configured environment and permissions. Inspect the events relevant to the affected update instead of assuming every pipeline exposes identical records. The proposed design here does not imply a specific ClairAI connector or event-log implementation.
Join the execution view with output checks. Establish which interval the target table contains, whether required inputs were accepted and whether the intended consumer refreshed against that output. A dependency relationship suggests where to inspect; it does not prove that a particular dashboard read the affected version. Mark consumers whose actual use has not been established as unverified.
Follow a hypothetical inventory delivery step by step
1 Establish what the consumer was promised
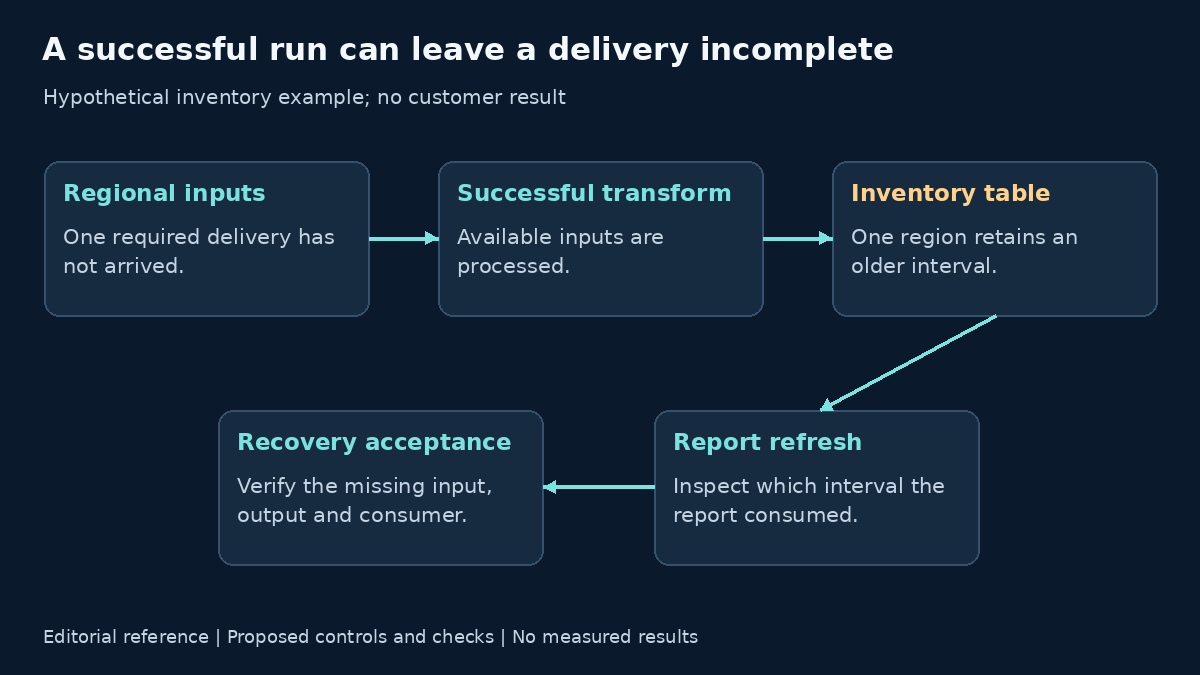
In this illustrative example, an inventory report should include all required regional deliveries for the current business interval. Its scheduled transformation runs successfully, but one region's input is absent. Begin with the report's acceptance rule and the source-arrival record. The absence is a delivery question requiring investigation, not proof of a Databricks compute failure.
2 Inspect what the successful run actually consumed
Locate the relevant job and task records, then inspect the inputs associated with that run. Suppose the transformation accepted the available regions and retained an older partition for the missing region. That behavior explains how execution success can coexist with incomplete freshness. It does not establish why the source failed to arrive or whether every downstream report used the output.
3 Verify the affected output and consumer
Check the business interval represented in the inventory table and the report's refresh record. If the report consumed the incomplete interval, record that impact explicitly. A replenishment process linked to the same table may be at risk, but its actual consumption remains a separate check. Do not label every connected system affected solely because it appears on a dependency map.
4 Prepare a recovery proposal with clear limits
Once the missing source is available, determine the smallest permitted repair or rerun. Check for duplicate writes, replacement semantics and downstream activity that occurred while the output was incomplete. Retain the original run evidence. A broad rerun can change outputs outside the affected interval and should not become the default simply because it is easier to launch.
5 Accept the corrected delivery
Verify that the required regions are present for the intended interval, the output passes its acceptance rules and the consumer has refreshed against the corrected data. Preserve any unresolved dependent work for its owner. This walkthrough is a hypothetical monitoring exercise. It provides no customer result, duration promise or evidence that a particular integration is already deployed.
| Investigation step | Evidence to retain | Decision |
|---|---|---|
| Define delivery | Interval, required regions and report acceptance | Which output is at risk? |
| Inspect execution | Job/task references and accepted inputs | What did the run actually process? |
| Verify impact | Table interval and consumer refresh | Which consumption is confirmed? |
| Bound repair | Input availability, write behavior and authority | What is the smallest permitted recovery? |
| Accept delivery | Completeness and corrected consumer result | Can the output be used? |
Route the alert to the team that can answer it
A failed task, missing input, rejected record and stale dashboard can require different owners. Route each condition with its evidence and the question that remains open. A platform team may restore execution while a data owner decides whether an incomplete interval can be released. The incident record should preserve those responsibilities instead of treating every problem as a job restart.
Escalate when the receiving team lacks permission, source ownership is unclear or the recovery could change data already consumed elsewhere. Include the relevant interval, records inspected, current uncertainty and proposed decision. When a business deadline is approaching, communicate the known delivery state even if the technical cause remains under investigation. Waiting for a complete diagnosis should not conceal unusable output.
Test monitoring gaps before the next delivery issue
Rehearse a late source, a successful transformation over stale input, a failed task and a dashboard that does not refresh. Also test monitoring credentials that lose access and records that arrive after the alert. Each condition should produce the intended operator state. A monitoring path that silently stops collecting evidence can otherwise resemble a healthy pipeline.
Use a dedicated acceptance dataset or approved test environment. Ask a receiving engineer to locate the affected delivery from the alert alone. Check whether the message includes a usable reference, actual business impact and a next action. Count unnecessary investigation and ambiguous routing as defects in the monitoring design, even when the original job event was detected correctly.
Keep platform facts and integration claims separate
Databricks documentation establishes available records and their limits. Your delivery contract establishes whether the data is fit for its intended use. ClairAI's public site describes Databricks monitoring; deployment-specific collection, permissions, latency and lineage coverage still require demonstration. Product evaluation should connect a real run to a real output check rather than relying on the presence of a platform name.
The ClairAI distributed-pipeline monitoring article explains the broader dependency problem. Here, the Databricks-specific decision is how notifications, job history and pipeline events contribute to a delivery investigation. Keep those sources distinct from the consumer evidence required to confirm impact and recovery.
Make the operating review about usable data
Maintain a delivery register alongside job configuration
The delivery register should identify each critical output, its business interval, expected inputs, consumer and accountable owner. Link it to the corresponding monitoring configuration without assuming that one job always represents one delivery. A workload can produce several outputs with different deadlines, and one output can depend on work outside Databricks. The register preserves that business relationship as the implementation changes.
Apply the intended business calendar and time zone consistently. A source-arrival timestamp, processing timestamp and report refresh timestamp can refer to different events. Record which timestamp supports each acceptance rule. Otherwise, a recently refreshed report can appear current even though its data belongs to an earlier interval, or an expected nonbusiness period can generate an unnecessary alert.
Keep the collection path under review as well. Limit polling and investigative queries to the evidence needed, assign an owner for permissions and record the expected reporting delay. Test what an operator sees when collection is unavailable. A usable design distinguishes an observed healthy delivery from a delivery whose monitoring evidence is missing; both can otherwise appear as an empty exception list.
Include the receiving business team in changes to acceptance rules. Technical owners can update a schedule, but they may not know that the report's decision deadline has moved. Review the agreed delivery whenever a consumer changes how it uses the data.
Review job failures alongside late inputs, unmet freshness rules, unresolved consumer checks and collection gaps. Establish owners for the delivery contract and monitoring configuration. When a schedule, source or report changes, revisit the corresponding acceptance tests. A monitoring configuration remains useful only while it represents the workload and business commitment currently in operation.
Discuss Databricks pipeline visibility with one important delivery, its expected interval and its downstream consumer. Ask how the proposed ClairAI deployment would surface both a failed run and a successful run that leaves the required data unavailable.
Frequently asked questions
Does a successful Databricks job prove that a report is fresh?
No. Confirm the expected data interval, required inputs and consumer refresh. Execution success and business delivery are separate checks.
Are jobs system tables a real-time alert feed?
Do not assume so. The documented delivery delay means recent records may be unavailable. Use a notification path appropriate to the workload's response requirement.
Which identifiers help connect the investigation?
Preserve workspace, job and run references together with the affected data interval and output version. Match task and pipeline-update evidence where applicable.
What should engineers check before rerunning a pipeline?
Confirm the missing or failed input, write behavior, permitted repair scope and downstream use. Identify the acceptance checks that will establish a corrected delivery.
When should a pipeline alert be escalated?
When missing access, uncertain data integrity, unclear source ownership or consequential downstream use prevents an authorized recovery decision. Send the evidence and unresolved question to the responsible team.
See ClairAI in action
Turn enterprise data chaos into confident, real-time decisions.
Schedule a Demo →